

Master Your SEO Keyword Ranking Report
Think of an SEO keyword ranking report as your main scorecard for online visibility. It's a detailed document that tracks where your website shows up on search engine results pages (SERPs) for a specific list of keywords. It tells you exactly where you stand against the competition and is absolutely essential for understanding your marketing impact and making smart, data-driven decisions.
Why Your Ranking Report Is Your Most Important SEO Tool

If you're not using a detailed SEO keyword ranking report, you're basically just guessing with your marketing budget. For a specialized business like a restaurant equipment supplier, knowing your digital footprint isn't just about data—it's about survival and growth.
Imagine trying to run a busy kitchen without knowing which burners are hot. That's what running an SEO campaign without a ranking report feels like. It gives you the feedback you need to fine-tune your strategy, showing you precisely what’s working and what isn’t.
A Direct Scorecard for SEO Efforts
A well-structured report is a direct scorecard for all your search optimization work. Did that new blog post about commercial charbroilers actually move the needle? Did updating your local citations improve visibility for "restaurant countertop grill near me"? The report gives you these answers with cold, hard data, not just gut feelings.
This clarity lets you double down on tactics that are winning—like targeted blog posting or blogger outreach—and pivot away from those that are falling flat. It turns your marketing from a shot in the dark into a predictable engine for growth, driving real results like more quote requests from chefs and restaurant owners.
Key Metrics to Prioritize in Your Ranking Report
When you first look at a ranking report, it can feel like a flood of data. To cut through the noise, focus on a few key metrics that give you the clearest picture of what's happening. For a business in the restaurant equipment supply industry, this is what you should be watching like a hawk.
| Metric | What It Tells You | Why It Matters for Restaurant Equipment Suppliers |
|---|---|---|
| Keyword Rank | Your website's position on Google for a specific keyword. | Shows if you're visible for high-intent terms like "commercial gas charbroiler." |
| Rank Change | How much your position has moved up or down over time. | Highlights which SEO efforts, like content writing, are paying off and where you're losing ground. |
| Search Volume | The average number of times a keyword is searched per month. | Helps you prioritize keywords that will actually drive meaningful traffic. |
| Ranking URL | The specific page on your site that is ranking for the keyword. | Confirms you're ranking the right product or category page for the search. |
| SERP Features | Whether you appear in a Featured Snippet, Image Pack, etc. | Identifies opportunities to dominate more of the search results page. |
By zeroing in on these data points, you get a clear, actionable overview of your SEO performance without getting lost in the weeds.
Uncovering Competitor Strategies
Your ranking report doesn't just tell your own story; it opens a window into your competitors' playbooks. By tracking their positions for the same high-value keywords, you can quickly spot their strengths and weaknesses.
Are they consistently outranking you for "floor model charbroilers"? Maybe their product pages are more detailed, or they’ve landed backlinks from influential foodservice blogs through effective blogger outreach. This kind of insight is gold for spotting opportunities to gain a competitive edge and carve out more market share.
A ranking report is more than a list of numbers; it's a strategic map. It shows you where you are, where your competitors are, and the most direct path to connect with customers actively searching for your equipment.
Pinpointing Valuable Traffic Sources
Not all keywords are created equal. A solid report helps you pinpoint which product categories are bringing in the most valuable search traffic. You might find that long-tail keywords like "easy-to-clean modular charbroiler" convert at a much higher rate than broader terms.
This level of detail is crucial for deciding where to put your time and money. The value of ranking number one is immense. In the competitive world of SEO, the #1 ranking position on Google captures roughly 27.6% of all clicks, leaving very little for the positions below it. This is why obsessing over your keyword rankings for terms like 'commercial charbroiler' is so critical for business success. If you want to dig deeper, check out the research on organic search dominance from Backlinko. This focus ensures your content and SEO efforts are locked in on the keywords that actually grow your bottom line.
Choosing the Right Tools and Keywords for Your Report
Building an effective SEO keyword ranking report really starts with getting the right ingredients together. Before you can even think about analyzing performance, you need reliable tools to pull the data and a smart list of keywords to track. Getting this foundational step right is what makes your report accurate, relevant, and genuinely useful for your restaurant equipment business.
The market for SEO software is pretty crowded. You've got heavy hitters like Semrush, Ahrefs, and SE Ranking all offering solid rank tracking features. For a restaurant equipment supplier, the best choice often boils down to which one is most accurate for niche e-commerce terms and how easily it can plug into your other data sources. Learning how to properly compare business intelligence software is a huge help in picking the right platform for your custom reports.
Selecting Your SEO Toolkit
For most of us, the sweet spot is a combination of a dedicated SEO platform and Google's own free tools. A platform like Semrush or Ahrefs is fantastic for keeping an eye on competitors and tracking daily rank changes. At the same time, Google Search Console (GSC) gives you the raw, unfiltered data straight from the source on how your site is actually doing in Google's index.
Here’s a quick look at what a typical SEO tool dashboard looks like, showing how you can monitor several key metrics all in one spot.
This kind of overview gives you a bird's-eye view of your organic traffic, keyword positions, and backlink health—all critical pieces of a complete seo keyword ranking report.
Connecting your chosen SEO software with Google Analytics and Google Search Console isn't just a suggestion; it's a must-do. This is what connects the dots between your keyword rankings and actual business outcomes. You'll finally be able to see how many people who searched for "countertop commercial charbroiler" actually ended up requesting a quote.
Moving Beyond Obvious Keywords
Once your tools are set up, the real strategy kicks in with picking your keywords. It’s so tempting to just track the big, high-volume terms like "charbroiler" or "restaurant grill." And while they’re important, these are usually hyper-competitive and don't always catch users who are ready to pull out their credit card.
The trick is to build a list that covers the entire customer journey, from when they're just starting to look to the moment they're ready to buy. This means digging up those high-intent, long-tail keywords that signal a user is much closer to making a purchase.
A truly strategic report doesn't just track vanity keywords. It focuses on the specific, detailed search queries that your ideal customers—chefs and restaurant managers—are using right before they make a purchasing decision.
Put yourself in your customers' shoes. What problems are they trying to solve? For instance:
- Problem-Aware Keywords: "best charbroiler for smoky flavor"
- Solution-Comparison Keywords: "gas vs electric commercial charbroiler"
- Purchase-Intent Keywords: "buy Vulcan VCRB36 countertop charbroiler"
- Niche-Specific Keywords: "easy-to-clean modular charbroiler for bistro"
Building out this kind of comprehensive list takes a real understanding of your products and your audience. You have to know not just what you sell, but how your customers actually go about searching for it.
Finding High-Intent Long-Tail Keywords
Your keyword research should be a mix of art and science. Start by just brainstorming all the different ways someone might search for your equipment. Think about features, brands, sizes, and specific uses.
Then, fire up your SEO tool's keyword research feature to expand that list and back it up with hard data. You're looking for terms that have a decent search volume but aren't impossible to rank for. A big part of this is getting a feel for search traffic nuances; for a deeper dive, check out our article on how to determine search volume for keywords. It’ll help you prioritize the terms that can actually move the needle.
By marrying the right tools with a smart, strategic approach to keyword selection, you're laying the foundation for an SEO report that drives real business growth, not just pretty charts and numbers.
How to Build a Custom Keyword Ranking Report
Turning raw data into a strategic asset—that’s the whole point of creating a custom seo keyword ranking report. Instead of just using a generic, one-size-fits-all template from a tool, building your own lets you zero in on the metrics that actually matter to your business. For an e-commerce site selling restaurant equipment, that means crafting a report that tells a clear story about performance, not just spitting out numbers.
The process all starts with a solid structure. A truly powerful report isn't just a data dump; it’s organized into logical sections that answer real business questions. This kind of structure ensures anyone, from the marketing team to the CEO, can grasp the narrative of your SEO progress.
Structuring Your Report for Clarity and Action
To create a report that delivers real value, it needs a logical flow. Think of it as guiding your reader through your SEO performance—starting broad and then drilling down into the nitty-gritty. Each section should build on the last, painting a complete picture of what's working and what isn't.
A great structure for a restaurant equipment supplier would cover four key areas:
- Overall Visibility Trends: This is your executive summary. It should offer a high-level view of your performance, tracking metrics like average keyword position and overall search visibility over time.
- Performance by Product Category: For an e-commerce site, this is non-negotiable. Grouping your keywords by product lines like 'Countertop Models,' 'Floor Models,' or 'Modular Units' shows you exactly which categories are pulling their weight.
- Competitor Rankings: SEO doesn't happen in a vacuum. This section tracks your top competitors for your most valuable keywords, revealing where they're winning and where you have opportunities to overtake them.
- New Keyword Opportunities: Your report should also be forward-looking. This is where you identify "striking distance" keywords—those lingering on pages 2-3 of Google that could be pushed to page one with a little extra effort.
This infographic breaks down the simple workflow: get the right tools, gather the data, and analyze keywords to build your report.
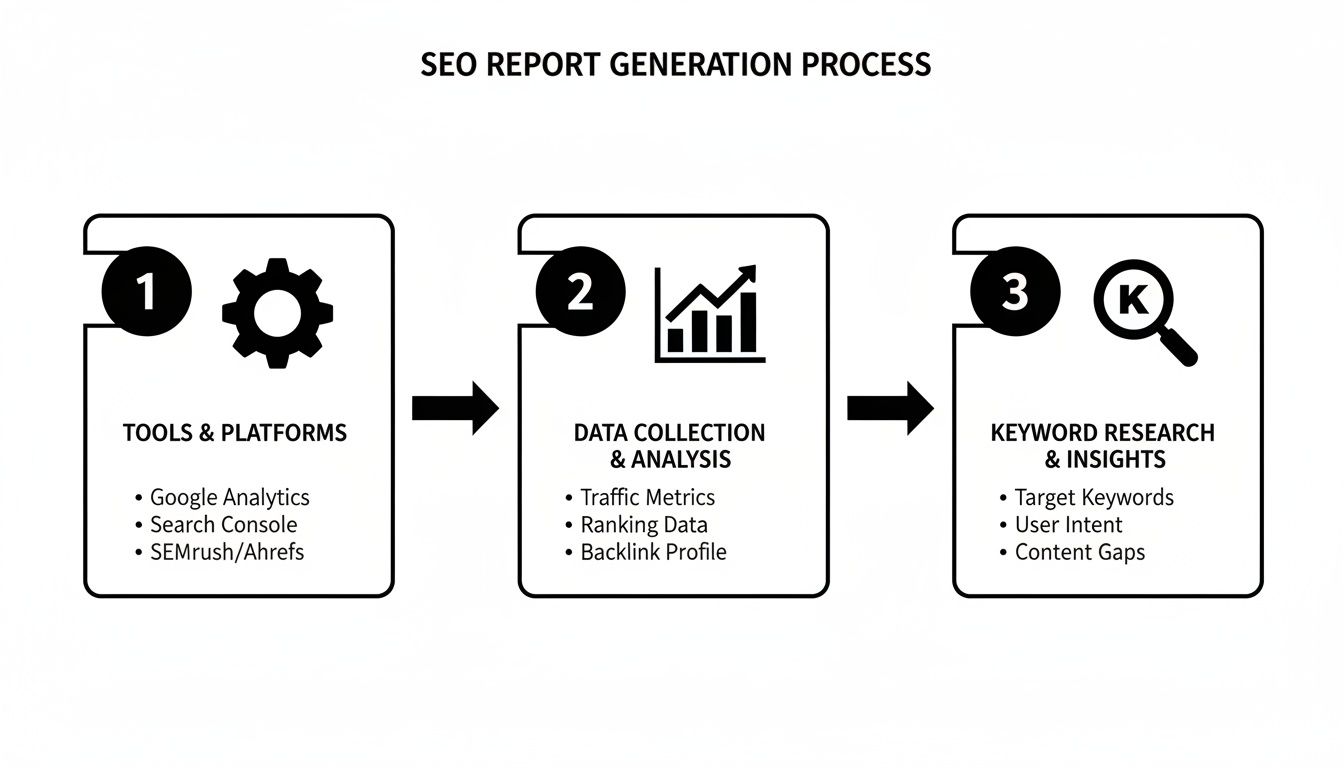
This visual just reinforces that a successful report is built on a solid foundation of the right tools and data, leading directly to insights you can actually use.
Pulling and Organizing Key Metrics
With your structure in place, it’s time to pull the essential metrics from your tools. Whether you're using Semrush, Ahrefs, or just Google Search Console, you'll need to export specific data points for every keyword you're tracking.
Get this data into a spreadsheet like Google Sheets or a dedicated dashboard tool. Your goal is to create a master sheet where you can easily sort, filter, and see what's happening at a glance.
Here are the crucial metrics to include:
- Keyword: The specific search term you are tracking.
- Current Rank: Your current position in the SERPs.
- Previous Rank: Your position from the last report.
- Rank Change: The difference between your current and previous rank.
- Search Volume: The average monthly searches for that keyword.
- Ranking URL: The exact page on your site that is ranking.
- SERP Features: Any special features you own (e.g., Featured Snippet, Image Pack).
The true power of a custom report is its ability to tell a story. By explaining the 'why' behind the numbers, you transform a simple data sheet into a strategic roadmap that guides your content and technical SEO efforts.
This level of detail allows you to spot trends quickly. For instance, if you see multiple keywords for 'Floor Models' dropping in rank, you know immediately to investigate that category page for problems. To get an even more granular view, you'll want a solid process for how to track keyword rankings effectively over time.
Why Long-Tail Keywords Matter
When building your report, it's easy to get fixated on high-volume head terms. But when you dig in, you’ll see the immense value of long-tail keywords. Diving into ranking data reveals a stark reality: nearly 74% of all keywords get 10 or fewer searches per month, while only 0.024% top 100,000 searches. This highlights a massive opportunity for niche players in the restaurant equipment space.
This insight is particularly vital for SEOs in the hospitality industry who need to target specific, high-intent terms like 'charbroiler for sandwich shops' or 'floor model charbroiler reviews.'
These long-tail keywords often have much higher conversion rates because they capture users who are further along in their buying journey. A chef searching for a "best 36-inch countertop charbroiler with radiant heat" knows exactly what they want and is probably ready to buy.
Your custom report should have a dedicated section for these long-tail gems. Tracking their performance lets you see the direct impact of your niche content—like blog posts or detailed product guides—on your bottom line. It’s this level of detail that elevates your seo keyword ranking report from a simple performance check to an indispensable tool for growing the business.
Turning Data into Actionable SEO Insights
A beautifully built SEO keyword ranking report is just a collection of numbers until you translate it into a strategic plan. The real value isn't in the data itself—it’s in the story it tells and the actions it inspires.
Learning to read between the lines is what separates a static report from a dynamic tool for growth. For a restaurant equipment supply website, this means turning a keyword's position into a direct line to chefs and restaurant owners ready to buy.
Diagnosing Critical Ranking Drops
One of the first things you'll use your report for is to act as an early warning system. When you spot a significant drop for a high-value keyword like "commercial gas charbroiler," your report is the first step in figuring out what went wrong.
The drop could come from a few places, and your job is to systematically check each one.
- Competitor Actions: Did a direct competitor just launch a new, more comprehensive product page for a similar charbroiler? Check their ranking URL for recent updates.
- Google Algorithm Updates: Major algorithm updates can shake up the search results. A widespread drop across multiple unrelated keywords is a big red flag that a core update might be the culprit.
- Technical SEO Hiccups: Was there a recent site change? An accidental 'noindex' tag on a category page or a broken internal link can cause rankings to plummet overnight.
- Content Decay: Has your content simply gone stale? If your "Best Charbroilers of the Year" guide is a year old, newer content will likely overtake it.
By digging into these possibilities, you can pinpoint the root cause and build a precise recovery plan instead of just guessing.
Identifying Keywords in Striking Distance
While fixing problems is critical, your report's greatest potential lies in uncovering opportunities. The best targets are often your "striking distance" keywords—those ranking on page two or three of the search results (positions 11-30).
These keywords are pure gold. Why? Because Google already sees your content as relevant; it just needs a little push to get over the finish line. For a restaurant equipment supplier, this could be a term like "smoky flavor steak grill" sitting at position 14.
A keyword ranking in position 14 isn't a failure; it's a low-hanging fruit. It signifies that with targeted optimization—like improving on-page SEO or building a few relevant internal links—you can achieve a page-one ranking and a significant traffic boost with minimal effort.
From here, you can create a specific content plan to boost these terms. This might involve expanding a product description, creating a detailed comparison guide (e.g., countertop vs. floor model charbroilers), or writing a supporting blog post that internally links back to the main product page. Knowing how to measure SEO performance accurately will help you track the impact of these specific actions.
This table breaks down how you might respond to different ranking shifts for a restaurant equipment website.
Interpreting Ranking Changes: What to Do Next
| Scenario | Potential Cause | Your Next Action for a Restaurant Equipment Website |
|---|---|---|
| "Commercial Charbroiler" drops from #3 to #12. | A competitor updated their category page, or there was a Google algorithm update. | First, check top competitors for recent content changes. Second, investigate industry news for recent Google updates. Update your own page with more detailed specs and better media. |
| "Best countertop charbroiler" moves from #15 to #9. | Recent blog post improvements or a new internal link is working. | Double down. Add a customer testimonial or a "how-to-choose" video to the page. Find one more relevant page to link from. |
| "How to clean charbroiler grill" suddenly appears at #25. | Google has indexed a new or previously unnoticed section of a blog post. | This is an opportunity. Create a dedicated, step-by-step guide formatted to win the Featured Snippet. Build internal links to it from related product pages. |
| Rankings for all "charbroiler parts" keywords fall. | Potential technical issue, like an accidental noindex tag on the parts category page or broken breadcrumb links. |
Run a site crawl immediately. Check Google Search Console for any new coverage errors or manual actions. |
Analyzing your report this way turns abstract data points into a clear, actionable roadmap. It’s all about connecting the dots and making smart, informed decisions.
Analyzing and Capturing SERP Features
Modern search results are more than just a list of blue links. They are packed with SERP features like Featured Snippets, People Also Ask boxes, and Image Packs. Your SEO keyword ranking report should track which of these features you've captured and where your competitors are showing up.
If a competitor owns the Featured Snippet for "how to clean a commercial charbroiler," go look at their content. They likely have a clear, concise, step-by-step answer that Google can easily pull. You can then rework your own content to provide an even better, more structured answer to capture that coveted "position zero." To speed up this analysis, you can even explore artificial intelligence report writing strategies for smarter, faster outputs.
The search landscape is always changing, and your analysis has to keep up. Just look at the recent trends—it’s a whole new ballgame.
Let Automation Handle Your Stakeholder Reports

Putting together your SEO keyword ranking report by hand every month is a massive time sink. It’s tedious, repetitive work that pulls you away from what actually matters—digging into the data and figuring out how to make real improvements. This is exactly where automation becomes your secret weapon, letting you work smarter, not harder.
Forget spending hours copying and pasting numbers into a spreadsheet. When you set up systems to do that heavy lifting for you, you’re free to focus on the story behind the numbers. This ensures your stakeholders get the insights they actually care about, without all the painful manual effort on your end.
Picking the Right Automation Platform
First things first, you need to choose the right tool for the job. Plenty of SEO platforms like Semrush or Ahrefs have report scheduling features built right in. These are fantastic for sending out regular updates automatically, and they often come with customizable, white-labeled templates you can brand as your own.
But for ultimate flexibility and deeper integrations, Looker Studio (what used to be Google Data Studio) is a total game-changer. It’s a free tool that plugs directly into your data sources—think Google Search Console, Google Analytics, and even your SEO software—to build live, interactive dashboards. This means your report is always current, showing performance in real-time.
With an automated dashboard, the owner of a restaurant equipment supply site can pop in and check keyword performance for "commercial charbroiler" whenever they want. No more waiting for a monthly email.
Designing Dashboards for Your Non-SEO Colleagues
When you’re showing results to a sales manager or the business owner, clarity is everything. They don’t need to see the technical SEO jargon; they need to understand the impact on the business. A great dashboard communicates the most important metrics at a single glance.
Keep the design clean, intuitive, and laser-focused on what matters to them.
- Start with the Big Picture: Lead with high-level numbers like overall search visibility, total organic traffic, and goal completions (like quote requests).
- Use Simple Language: Label your charts clearly. Instead of "CTR," spell it out: "Click-Through Rate." It's also helpful to add small text boxes explaining what each chart actually means for the business.
- Focus on Trends Over Time: Stakeholders want to see progress. Showing data from the last 30, 90, or 180 days gives them crucial context and proves the long-term value of your work.
The point of an automated dashboard isn't to bury people in data. It's to provide quick answers to key business questions. Is our online visibility growing? Are we getting more leads from search? Which product categories are driving the most traffic?
Your dashboard should be a self-service resource that lets stakeholders see the value of SEO for themselves, without needing you to hold their hand through every single data point.
Data Visualization That Tells a Story
How you show your data is just as important as the data itself. Smart visualization turns a bunch of complex numbers into a story that’s easy to understand. Different types of charts are better for different kinds of data.
Here’s a quick guide for your restaurant equipment report:
- Line Graphs: Perfect for tracking trends. Use them to show how average keyword position, organic traffic, and visibility scores change over time for key product categories like "Countertop Models."
- Bar Charts: These are your go-to for direct comparisons. You could use one to compare the number of keywords ranking in the top 3, top 10, and on page one.
- Pie or Donut Charts: Excellent for showing how something is distributed. A pie chart can instantly show the percentage of keywords ranking for "charbroilers" versus "grills."
- Simple Scorecards: For those single, all-important metrics like total organic conversions or average ranking position, use big, bold scorecards right at the top of the dashboard. They grab attention immediately.
By automating your SEO keyword ranking report with clean, intuitive dashboards, you’re not just saving time—you’re elevating the entire conversation. You shift from just reporting numbers to demonstrating real business value, making your SEO efforts a critical part of the company's success.
Common Questions About Ranking Reports
Even after you've got a handle on building and reading an SEO keyword ranking report, you're bound to have some questions. It’s totally normal. For restaurant equipment suppliers, getting these answers straight can be the difference between a report that just sits there and one that actually helps grow the business.
Let’s get right into the questions we hear all the time from restaurant owners and marketing managers. No fluff, just direct answers to help you sidestep the common traps and squeeze every bit of value out of your SEO data.
How Often Should I Run a Ranking Report?
The honest answer? It depends on your goals and how much SEO work you're actively doing.
For most businesses, pulling a monthly report is the sweet spot. It's frequent enough to see how your latest content or website tweaks are performing, but not so often that you get lost in the day-to-day noise of minor ranking shifts.
But say you've just launched a new line of modular charbroilers or you’re in the middle of a big site migration. In that case, switching to a weekly report gives you much faster feedback. You can spot any sudden ranking drops and fix them quickly, or double down on what’s clearly working right out of the gate.
Quick tip: Don't obsess over daily rank changes. Search engine rankings bounce around naturally. Looking at longer-term trends—think monthly or quarterly—gives you a far more accurate (and less stressful) picture of what’s really happening.
Why Do My Rankings Differ from What I See When I Search Myself?
This is easily one of the most common points of confusion we see, and the short answer is personalization. Google isn’t showing you the same results it shows your potential customers. It’s showing you what it thinks you want to see.
Several things are at play here:
- Your Location: A chef searching for "commercial charbroiler near me" in Chicago is going to see completely different results than one in Miami. Your report tool uses a neutral location to show a truer, non-personalized average rank.
- Your Search History: Google remembers the sites you visit. If you’re constantly checking your own website (who isn't?), Google gets the hint and is more likely to show it to you in a higher position.
- The Device You Use: Mobile and desktop rankings can be different, especially for local searches. Any good SEO keyword ranking report will let you split up your data by device so you can see the full picture.
What Is a Good Average Ranking Position?
Everyone wants to hit that number one spot, but the idea of a single "good" average ranking is a bit misleading. It all depends on your industry and how competitive your keywords are.
A much more useful way to look at it is the distribution of your rankings. The real goal is to consistently grow the number of keywords ranking in the top 10, and even better, the top 3.
Instead of getting hung up on one average number, focus on progress. Celebrate moving a keyword from page three to page one—that’s a huge win! That’s where you start seeing real, meaningful traffic. A healthy report is one that shows a steady flow of keywords moving up into those higher-ranking buckets month after month.
At RestaurantEquipmentSEO.com, we know that getting your equipment seen by the right chefs and restaurant managers is what it’s all about. We provide comprehensive SEO services, including local citation management, expert blog posting, targeted blogger outreach, and high-quality article writing specifically for restaurant equipment supply websites. Let us help you take your menu to the next level.