

How to Determine Search Volume for Keywords
To figure out how many people are searching for your keywords, you'll need to use a mix of tools. Something free like Google Keyword Planner can give you a starting point, but you'll want paid SEO platforms to get more accurate monthly numbers. This data shows you exactly how many times people search for a term, giving you a clear picture of its popularity and potential to bring traffic to your site.
Why Search Volume Is More Than Just a Number
Keyword search volume is so much more than a number on a spreadsheet—it's a direct signal of what your customers actually want. Get this wrong, and you'll end up creating content nobody is looking for or optimizing for keywords that never lead to a sale.
Think of it as the compass for your digital strategy. The search volume data you pull will guide everything from your content calendar to your ad spend. It tells you which topics your audience cares about and which products they’re ready to buy right now.
Unpacking the Business Impact
Let’s walk through a real-world example. Imagine you run a website selling restaurant equipment. You have two similar products: "commercial charbroilers" and "restaurant grills." A quick keyword search shows "restaurant grills" gets 1,200 searches a month, while "commercial charbroilers" only gets 450.
At first, jumping on the higher-volume keyword seems like a no-brainer. But if you dig a little deeper, you'll see that "restaurant grills" is a broad term—a lot of those searches are from home cooks looking for a fancy grill for their backyard. In contrast, "commercial charbroilers" is a highly specific term used almost exclusively by chefs and restaurant owners. Your ideal customer.
This single insight changes your entire game plan:
- SEO Prioritization: You’d immediately shift focus to the "commercial charbroiler" page because it attracts qualified, ready-to-buy leads.
- Content Creation: Instead of generic grilling tips, you could create a blog post like "The Chef's Guide to Selecting a Commercial Charbroiler" to pull in that high-intent audience. This is where our expert article writing services come in handy.
- Blogger Outreach: You'd partner with food service industry blogs, not backyard BBQ influencers. This is a core part of our blogger outreach strategy for clients.
Understanding the nuance behind the numbers is what separates wasted effort from profitable strategy. The goal isn't just traffic; it's attracting the right traffic that turns into paying customers.
Understanding Core Volume Concepts
Search volume is never a fixed number. It ebbs and flows, and you need to understand why to plan effectively. Seasonality is a huge factor. For example, searches for "commercial patio heaters" will obviously spike in the fall as restaurants prep their outdoor spaces for colder weather. Knowing this lets you time your content and ad campaigns perfectly to catch that wave of demand.
Modern tools also offer historical data that goes way beyond a simple monthly average. Since around 2019, platforms using Google's Keyword Planner data have provided detailed monthly stats, including cost-per-click (CPC) and competition levels for specific locations. This data is updated monthly, so you’re not working with a static number. You can even see the average searches over the last 12 months alongside bid estimates, helping advertisers nail down a keyword's true value. You can discover more insights about these historical search volume metrics and how they’re used.
Your Toolkit for Measuring Keyword Search Volume

To get a real handle on keyword search volume, you need more than just one tool. Relying on a single source is like trying to understand a city by only visiting one street—you get a tiny piece of the picture, but you miss the full story. A much smarter approach is layering data from different platforms to build a complete, reliable picture of what your customers are actually looking for.
Our workflow always starts with the free, powerful tools everyone has access to. Then, once we have a baseline, we move to more specialized paid platforms to dig deeper. Think of it as starting with a wide-angle lens and gradually zooming in for the critical details.
Starting with Google's Free Powerhouses
Your first stop should always be Google’s own backyard. These tools pull data directly from the source, giving you a solid foundation for any SEO or content strategy.
-
Google Keyword Planner: This is the classic starting point. Originally built for advertisers, it’s perfect for getting average monthly search volume ranges and discovering new keyword ideas. If you’re a restaurant equipment supplier, you could pop in a "seed keyword" like "commercial refrigerators" to see its search volume and uncover related terms people are looking for, like "walk-in cooler" or "undercounter freezer."
-
Google Trends: This one doesn't give you hard volume numbers. Instead, it shows the relative popularity of a topic over time, plotted on a simple 0 to 100 scale. It's our go-to for spotting seasonality. A quick search for "commercial patio heaters" in Google Trends would almost certainly show a huge spike every autumn, telling you exactly when to push promotions or publish new buying guides.
Using these two together gives you both a baseline volume estimate and the crucial context of when that volume happens. This is a non-negotiable first step before you even think about spending money on other tools.
Gaining a Competitive Edge with Third-Party Tools
While Google's tools are essential, their data can be pretty broad. That's where premium third-party platforms really shine. Companies behind these tools invest heavily in processing and refining mountains of search data to give you more precise volume estimates, competitive metrics, and insights you simply can't get for free.
Instead of a wide range like "1K-10K," these platforms often provide a single, specific search volume number (like 2,400 monthly searches), which is way more useful for forecasting traffic. They also show you what your competitors are ranking for, basically handing you a roadmap of topics that are already working.
The real magic of third-party tools is how they connect search volume to competitive difficulty. A keyword might have huge volume, but if the top 10 results are all major national brands with massive budgets, it's probably not worth your time. These tools help you find the sweet spot: keywords with good volume and a realistic chance of ranking.
To really measure keyword search volume effectively, it's worth getting familiar with leading SEO tools like SEMrush Pro and Ahrefs. Each one has its own unique features and way of presenting data, so finding the one that clicks with your workflow is key.
Before we get into a workflow, let's break down how these tool types stack up against each other.
Comparison of Keyword Search Volume Tools
| Tool | Primary Use Case | Data Granularity | Cost | Best For |
|---|---|---|---|---|
| Google Keyword Planner | Initial keyword discovery & ad campaign planning | Broad ranges (e.g., 1K-10K) | Free | Getting baseline volume estimates and finding new keyword ideas. |
| Google Trends | Analyzing search interest and seasonality | Relative popularity (0-100 scale) | Free | Identifying seasonal demand and comparing topic popularity over time. |
| Third-Party SEO Tools | In-depth competitive analysis & content strategy | Specific estimates (e.g., 2,400) | Paid Subscription | Prioritizing keywords based on precise volume and difficulty scores. |
As you can see, the free tools are perfect for exploration, while paid tools are built for execution and prioritization.
A Layered Approach for Maximum Accuracy
The most effective way to figure out search volume is to build a simple workflow that uses multiple sources. Don't just pick one tool and call it a day; triangulate your data for a much clearer, more accurate picture.
Here’s a straightforward process that works every time:
- Brainstorm Seed Keywords: Start with the obvious, broad terms for your products, like "charbroilers" or "commercial ovens."
- Get Baseline Data: Use Google Keyword Planner to see the average monthly search ranges and uncover some related long-tail keywords you might have missed.
- Analyze Seasonality: Plug your best keywords into Google Trends to see if there are any seasonal peaks or lulls in demand you need to plan for.
- Refine and Prioritize: Finally, take your refined list and run it through a third-party tool like Ahrefs, Moz, or Semrush. Use their more precise volume data and keyword difficulty scores to decide which terms you should go after first.
Of course, once you've picked your keywords, the work is just getting started. You have to create the content and then see how it performs. To learn more about that piece of the puzzle, check out our guide on how to track keyword rankings and measure your results. This layered strategy ensures you're not just chasing numbers, but making smart decisions that line up with real customer behavior.
How to Actually Understand Search Volume Data
https://www.youtube.com/embed/YnmcARfd39U
Finding a keyword's search volume is the easy part. The real work—the part that separates successful content from wasted effort—is figuring out what those numbers really mean for your business.
Without context, these metrics are just noise. Getting this right is the difference between writing a blog post that brings in ready-to-buy customers and one that just attracts window shoppers.
Google's Ranges vs. Specific Tool Estimates
One of the first things you'll notice is the difference between the broad ranges you get from Google Keyword Planner (like 1K-10K searches a month) and the pinpoint estimates from paid tools like Ahrefs or Semrush.
Don't think of one as "right" and the other as "wrong." They're just different tools for different jobs. Google's ranges are fantastic for early-stage brainstorming. They give you a quick, directional sense of a topic's popularity. Paid tools, on the other hand, offer more precise numbers that are much better for forecasting traffic and deciding which keywords to prioritize right now.
Reading Between the Lines of Seasonality
Search volume is almost never a flat line. It ebbs and flows with the seasons, buying cycles, and whatever trend is hot this month. For a restaurant equipment business, ignoring seasonality isn't just a mistake—it's a massive missed opportunity for sales.
Take a keyword like "outdoor patio heaters for restaurants." A simple yearly average might make it look like a moderately popular term. But that average is lying to you.
The reality is that searches for this are probably dead flat from April through August. Then, they explode in September and October as restaurant owners start feeling that first autumn chill and scramble to keep their patios open.
Knowing this changes everything:
- Content Timing: You'd publish your "Ultimate Buyer's Guide to Commercial Patio Heaters" in late August, right before the search wave hits.
- Ad Spend: Instead of a steady monthly budget, you'd pour most of your Google Ads money into those crucial fall months when people are actually looking to buy.
- Inventory Management: You'd make sure your warehouse is stocked and ready for that predictable spike in demand.
This kind of foresight puts you miles ahead of competitors who are just looking at a simple monthly average and reacting way too late.
The real insight comes from seeing search volume not as a single number, but as a dynamic trend line. Your job is to align your marketing efforts with the peaks and troughs of that line to maximize impact and ROI.
Moving Beyond Volume with Related Metrics
High search volume feels good, but it's a vanity metric if it doesn't lead to sales. To figure out a keyword's true value, you have to look at it alongside a few other critical numbers. These data points finish the story that search volume only starts to tell.
Think of it this way: search volume tells you how many cars are on the road. These other metrics tell you about the traffic, the cost of the toll, and who else is driving.
-
Keyword Difficulty (KD): This score (usually from 0-100) gives you a rough idea of how hard it will be to crack the first page of Google. A keyword with 10,000 monthly searches and a KD of 95 is practically useless for a smaller business. But a keyword with 800 searches and a KD of 10? That's a real opportunity to get traffic.
-
Cost Per Click (CPC): This tells you what advertisers are willing to pay for a single click. A high CPC is a dead giveaway that a keyword has strong commercial intent. If other businesses are bidding up a term like "commercial charbroiler for sale," you can bet that the people searching for it are ready to open their wallets.
Finding the Sweet Spot: Volume, Intent, and Potential
At the end of the day, your goal isn't just to find keywords with the most searches. It's to find the ones with the most potential.
A keyword's real value is a mix of three things: search volume, ranking difficulty, and user intent. The sweet spot is a term with decent search volume, a difficulty score you can realistically compete with, and an obvious intent that matches what you sell.
For example, a blog post on a high-volume, vague keyword might get you thousands of visitors who bounce immediately. On the flip side, a very specific, lower-volume term can bring in a handful of highly qualified buyers who are ready to make a deal. This is where our SEO agency can give you a huge edge with strategic thinking.
You can dive deeper into finding these hyper-specific, high-value phrases in our guide to long-tail keyword research. True success comes when you stop chasing big numbers and start seeing search volume as just one piece of a much larger strategic puzzle.
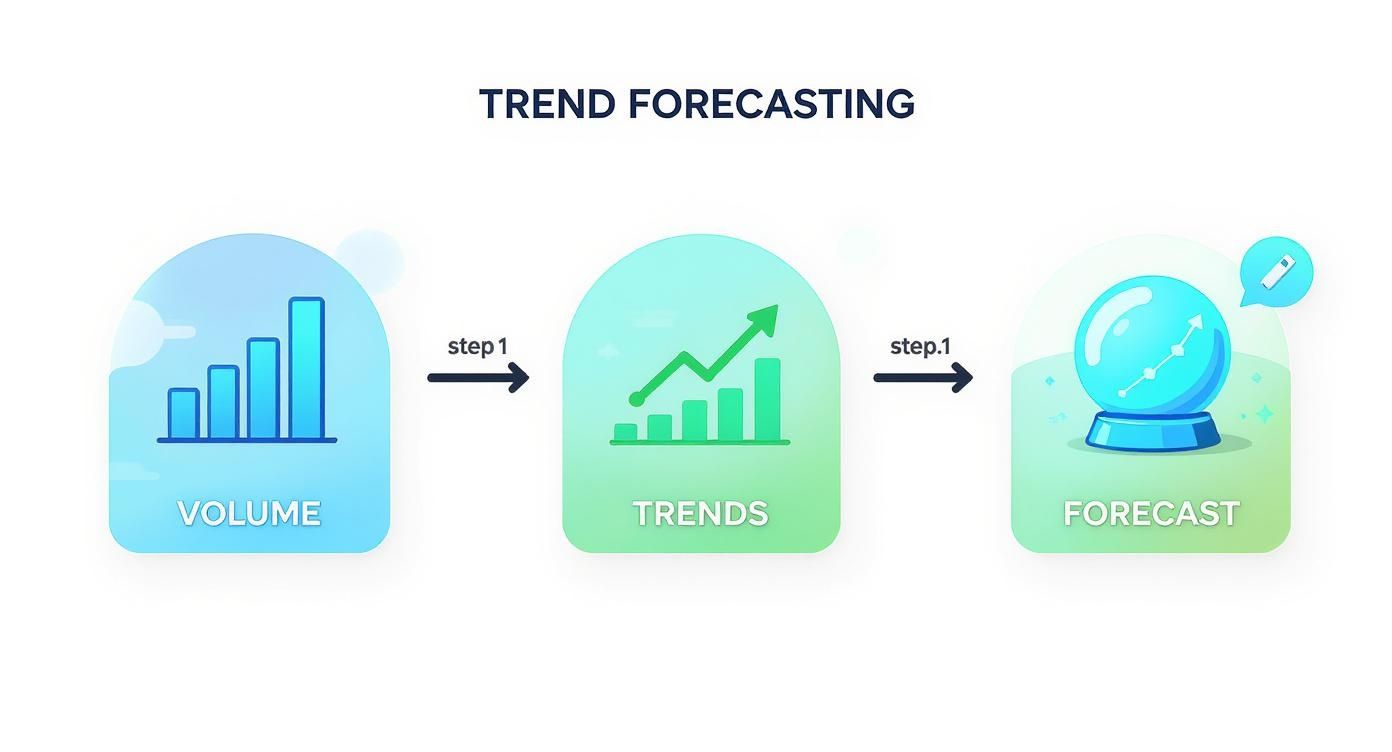
Fusing Trend Data with Volume for Smarter Forecasts
Relying on a static monthly search volume is a bit like driving while only looking in the rearview mirror. It shows you where keyword demand has been, but it gives you zero clues about where it's headed. This is where trend data becomes your secret weapon, turning a simple number into a powerful forecasting tool.
When you blend the historical context from a tool like Google Trends with the raw volume data you get from Keyword Planner or other SEO tools, you start to see the bigger picture. A keyword's trend line reveals its trajectory—is interest growing, declining, or spiking at predictable times? That's a layer of dynamic insight a simple monthly average will never give you.
From Reactive to Proactive SEO
This approach is what lets you shift from a reactive to a proactive strategy. Instead of chasing last month's numbers, you can start getting ahead of future demand. This is absolutely critical in the restaurant equipment world, where new culinary concepts can create a sudden rush for specific types of gear.
Take the keyword "ghost kitchen equipment" for example. A few years back, its monthly search volume was probably next to nothing. A quick glance at a static number would have told you to ignore it completely.
But if you had layered on trend data, you would have seen a sharp, upward trajectory. That's the signal of an emerging market opportunity—a chance to get ahead of the curve by creating content and optimizing pages before your competitors even know what's happening. This kind of foresight lets you plan your SEO and marketing calendars with confidence, aligning your efforts with where the market is going, not just where it is today.
Interpreting the Trend Line
Understanding what a trend line is telling you is the key to unlocking its value. Not all trends are created equal, and each pattern points to a different strategic move.
-
Rising Keywords: These show a steady climb in popularity over time. They represent growing markets and are often perfect long-term targets for foundational content like ultimate guides or detailed product comparisons.
-
Declining Keywords: These are losing steam. While they might still have decent volume right now, investing heavily in them is a risky bet. It’s usually better to pivot your focus to newer, more relevant terminology.
-
Seasonal Keywords: These have predictable peaks and valleys. If you're a charbroiler supplier, a term like “outdoor commercial grill” is almost guaranteed to spike every spring. You can plan your content and promotions to launch just before this annual surge hits.
Fusing these two data sources—volume and trends—transforms your keyword research from a simple data-pulling exercise into a strategic forecasting activity. It helps you allocate resources effectively, ensuring you're focusing on keywords with future potential, not just past performance.
How Trend Data Gets Its Volume
The way we get search volume for keywords has come a long way. When Google Trends first launched back in 2006, it only provided normalized interest scores on a 0-100 scale. This showed relative popularity but not the actual number of searches.
To solve this, modern SEO tools developed a clever method. They combine this trend data with the concrete volume figures from Google Keyword Planner. By matching and scaling the normalized trend scores against known monthly search volumes, they can generate reliable historical search volume estimates going back years.
This combined data is invaluable. To get an even deeper understanding of market dynamics, exploring various trend analysis methods can help you spot more nuanced patterns and seasonal shifts in your keyword data.
For restaurant equipment suppliers, this can be a game-changer for local SEO. Analyzing trends at a city or state level can reveal pockets of regional demand that a national overview would completely miss. Our guide on local keyword research digs into exactly how to apply these concepts to a specific geographic area.
An Advanced Method for Pinpointing Monthly Volume
While annual averages and trend lines are useful, sometimes you need to get more granular. You need to know, with as much certainty as possible, what the search volume is for a specific month. This is where a more advanced statistical approach comes in, one that moves beyond simple estimates and into calculated forecasting.
This method, which we sometimes call the "Multiplier K" adjustment, sounds complex, but it's really quite straightforward. It works by taking the relative popularity data from Google Trends and calibrating it against the known annual average search volume from a tool like Google Keyword Planner. The result is a much more accurate, month-by-month breakdown of search demand.
Calculating Your Seasonal Multiplier
At its core, this technique creates a multiplier that converts Google Trends' relative scores (which are on a scale of 0-100) into actual search volume figures. You don't need a data science background for this, just a few simple calculations.
Let’s walk through it with a practical example for a restaurant equipment supplier. Imagine you want to pinpoint the monthly volume for the keyword "commercial ice machine."
- First, find the average monthly search volume. A tool like Keyword Planner might tell you it’s 5,400 searches per month on average.
- Next, get the monthly trend scores. Head over to Google Trends and export the interest scores for "commercial ice machine" for the last 12 months.
- Then, calculate the average trend score. Add up all 12 monthly scores and divide by 12. Let's say the average trend score comes out to 75.
- Finally, create your multiplier. Divide the average monthly search volume by the average trend score. In this case: 5,400 / 75 = 72. This number, 72, is your "Multiplier K."
This process is what takes you from raw data to a real forecast you can build a strategy around.
This workflow helps transform abstract data points into a concrete, actionable plan for your content and marketing calendar.
Putting Your Multiplier to Work
Now that you have your multiplier, you can apply it to each month's specific trend score to get a much more reliable volume estimate.
For instance, if the Google Trends score for "commercial ice machine" was 92 in July (peak summer heat), your estimated search volume for that month would be 92 x 72 = 6,624 searches.
On the flip side, if the trend score dipped to 55 in December, the estimated volume would be 55 x 72 = 3,960 searches. Suddenly, you have a clear, data-backed picture of seasonal demand that is far more useful than a simple annual average.
This method empowers you to pinpoint the perfect time to launch a promotion, publish a critical buying guide, or ramp up your ad spend. It turns a vague sense of seasonality into a predictable, quantifiable business opportunity.
Merging relative trend data with absolute volume metrics is a statistically solid way to understand search volume. By creating this multiplier, you can identify seasonal swings and forecast demand much more reliably, spotting both emerging and declining keyword opportunities with greater confidence.
You can see more applications of this technique in this deep dive into historical keyword data analysis on MomenticMarketing.com. This level of precision is what allows you to make smarter, more profitable decisions based on real user behavior.
Got Questions About Keyword Search Volume?
Even when you're armed with the best tools, you’ll probably run into a few questions once you start digging into search volume data. It's totally normal. Let's walk through some of the most common ones we hear to clear up any confusion so you can use this data with confidence.
These are the kinds of practical details that can make or break a content strategy, especially in a niche industry like restaurant equipment.
Is Higher Search Volume Always Better?
Absolutely not. While a big, flashy number looks impressive, it's often just a vanity metric. A keyword like "restaurant ideas" gets a ton of searches, but the audience is all over the place—it could be culinary students, dreamers, or people just browsing Pinterest.
Now, compare that to a long-tail keyword like "best commercial charbroiler under $2000". The search volume will be way lower, but think about who's typing that in. Every single one of them is a hot lead for an equipment supplier, likely with a credit card ready to go. The goal isn't just traffic; it's the right traffic.
It’s like fishing. You can cast a massive net into the ocean and catch a bunch of random stuff, or you can use the right bait in the right spot to catch exactly the fish you’re after. Those lower-volume, high-intent keywords are your perfect bait.
This is why understanding the intent behind the search is just as crucial as the volume itself.
How Accurate Is This Data, Really?
Here's the truth: search volume data from any tool is an educated guess, not a hard fact. Even Google gives you ranges. Third-party tools use complex algorithms and real user data to make their estimates, but you'll never see two tools show the exact same number.
Instead of getting hung up on a precise figure, focus on what the data tells you directionally.
- Is keyword A searched way more often than keyword B?
- Does interest for this topic spike during a certain season?
- Is the search volume for this term generally trending up or down?
These are the insights that actually help you make smart decisions. Obsessing over whether a keyword gets 2,400 or 2,600 searches a month is a waste of time. Use the numbers for comparison, not as gospel.
Can I Figure Out Search Volume for Free?
Yes, you can, and you should start there! Tools like Google Keyword Planner and Google Trends are fantastic for getting your feet wet without spending a penny. They'll give you a solid foundation for your research.
But there’s a catch. Unless you're running an active Google Ads campaign, Keyword Planner often spits out huge volume ranges like 1K-10K. That makes it pretty tough to tell which keywords are the real winners.
If you're on a tight budget, my advice is to use the free tools to build your initial lists and get a feel for trends. Once you have some traction, investing in a paid tool—even for a single month—can give you the more granular data you need to really pull ahead of the competition. A one-month subscription can easily give you enough keyword ideas to plan your content for the next year.
How Often Should I Be Checking This Stuff?
Keyword volume is not a "set it and forget it" kind of thing. Customer needs change, new trends pop up, and old keywords can fade away. For your core commercial keywords—the ones that are directly tied to your products, like "floor model charbroilers"—we recommend taking a look at the search volumes every quarter.
For your broader blog and content topics, checking in once or twice a year is probably fine. The main thing is to stay alert to big shifts in the market. If a new type of cooking tech starts making waves, you'll want to jump on the search volume for it right away to see if it's an opportunity. Regular check-ins keep your SEO strategy sharp and focused on what your customers are looking for now.
At RestaurantEquipmentSEO.com, we know that getting your products in front of the right chefs and restaurant owners starts with smart SEO. From local citation services and expert blog posting to targeted blogger outreach and professional article writing, we provide the digital marketing solutions your restaurant equipment supply website needs to dominate the search results. Contact us to learn how we can help you grow.